The Problem: “The App Feels Slow” Is Not a Diagnosis
Every SaaS founder eventually hears this sentence:
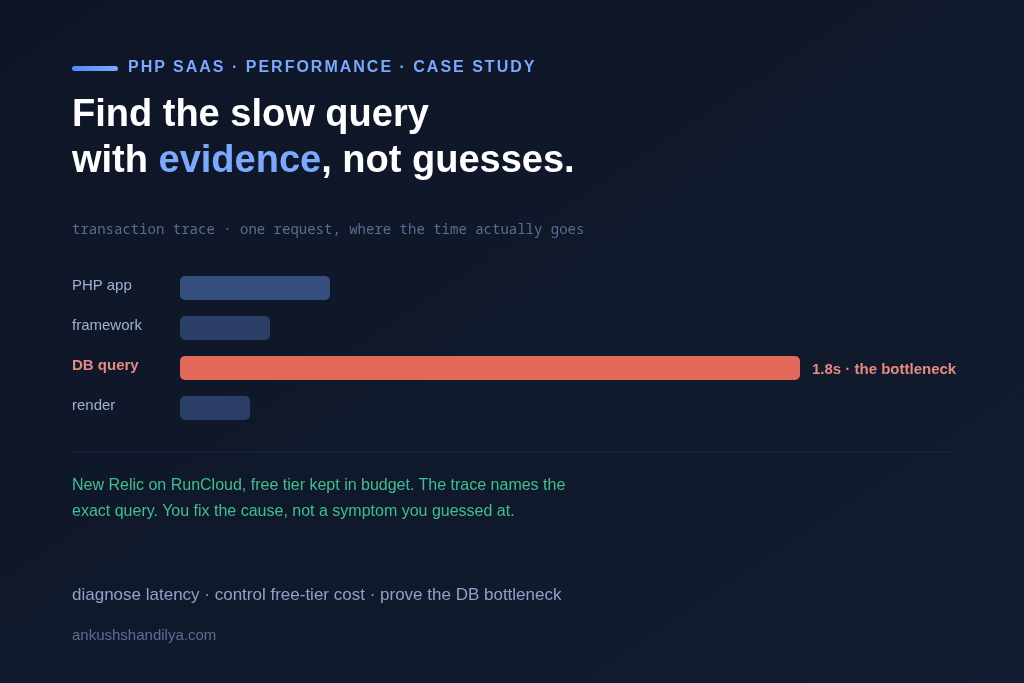
“The application feels slow.”
In our case, this was a PHP-based SaaS application hosted on a RunCloud-managed server.
Pages loaded, features worked, but latency was noticeable — especially on DB-heavy screens.
At this stage, many teams do one of the following:
- Add
microtime(true)logs - Run random SQL
EXPLAINs - Guess the bottleneck
- Blame hosting, PHP version, or MySQL
All of these are symptoms-driven debugging, not evidence-driven engineering.
The real requirement was clear:
We needed hard proof — measurable, repeatable, explainable — before touching code.
Choosing the Right Observability Tool: Grafana, Prometheus, or New Relic?
Before installing anything, I evaluated three mainstream options.
Option 1: Grafana + Prometheus
Pros
- Open source
- Powerful for infrastructure metrics
- Popular with DevOps teams
Cons
- Not application-aware by default
- Requires exporters, instrumentation, dashboards
- Weak for PHP-level transaction tracing
- High setup + maintenance cost
Great for infra teams, not ideal for fast PHP diagnostics.
Option 2: Custom logging + slow query logs
Pros
- Free
- Simple in theory
Cons
- No request-level correlation
- No end-to-end visibility
- No latency breakdown
- Easy to misinterpret
Useful for small scripts, insufficient for SaaS platforms.
Option 3: New Relic APM
Pros
- Application-level visibility
- Request → PHP → DB correlation
- Minimal setup time
- Clear evidence (graphs, traces, timings)
Cons
- Paid product
- Free tier must be used carefully
Best choice for fast, evidence-driven investigation — if used correctly.
The Strategy: Using New Relic’s Free Tier Without Burning Credits
New Relic’s free plan is powerful but dangerous if misconfigured.
The risk
- Logs ingestion can eat 100 GB quickly
- Infrastructure agent can silently consume quota
- Multiple services can fragment data
The strategy I followed
To stay 100% within free limits, I:
- Enabled only PHP APM
- Disabled:
- Infrastructure agent
- Logs (Fluent Bit)
- Distributed tracing
- Custom events
- Used one application name
- Focused strictly on transactions and DB timing
This turned New Relic into a precision diagnostic tool, not a monitoring bill.
The Real Challenge: Installing on RunCloud
RunCloud is excellent, but it does not use standard PHP paths.
Challenges faced:
- Custom PHP builds (
php84rc) - Non-standard
conf.dlocations - PHP-FPM context different from CLI
- Agent auto-detection partially works
- Infrastructure agent auto-starts (logs risk!)
Key lessons:
- Trust
php --ini, not assumptions - Separate CLI vs PHP-FPM mental models
- Always verify running processes
- Never assume logs are “off” — prove it
This is where experience matters.
Most “copy-paste” tutorials fail here.
The Investigation: Evidence, Not Opinions
Once APM was live and controlled, the truth surfaced quickly.
What New Relic showed:
- ~99% of DB time spent in
MySQL triggers select - Query volume was normal
- Latency was structural, not traffic-driven
Why this mattered:
- The slowdown was not PHP
- Not hosting
- Not network
- It was business logic embedded in database triggers
This is exactly the kind of issue:
- Manual debugging misses
- Logs hide
- Only APM exposes clearly
This was our proof.
The Next Phase: Optimization & Continuous Validation
With evidence in hand, the roadmap became obvious:
Planned actions:
- Audit MySQL triggers
- Move business logic to PHP where appropriate
- Reduce implicit DB work
- Cache predictable computations
- Re-test using the same New Relic dashboards
The key principle:
Never optimize blind. Measure → Change → Measure again.
What This Case Study Really Demonstrates
This is not just about PHP or New Relic.
It demonstrates:
- Calm decision-making under ambiguity
- Cost-aware tooling choices
- Production-safe debugging
- Deep understanding of PHP, MySQL, and cloud platforms
- Ability to operate independently without chaos
This is how senior remote contributors work.
Frequently Asked Questions
How do you diagnose slow PHP applications?
By using application performance monitoring tools like New Relic to measure transaction time, database queries, and infrastructure response rather than relying on assumptions.
How do you diagnose slow PHP applications?
By using application performance monitoring tools like New Relic to measure transaction time, database queries, and infrastructure response rather than relying on assumptions.
Is New Relic free tier enough for SaaS debugging?
Yes, when configured correctly with only APM enabled and logs/infrastructure disabled, the free tier is sufficient for deep performance investigation.